If you would prefer to view this analysis as a PDF, you can download the report here.
It is well known that public spending in Scotland is higher than in the rest of the UK, and that most of the extra expenditure is within the budget of the Scottish government. Data is published both in Government Expenditure and Revenues in Scotland, by the Scottish Government, and for the whole UK in the Public Expenditure Statistical Analysis produced by HM Treasury (PESA). In this article we update the 2017 Gwilym Gibbon Centre for Public policy paper, Public Spending in Scotland: Relativities and Priorities, where Prof JD Gallagher presented data from PESA which demonstrated the relative spending advantage in Scotland.
He concluded that spending within the Scottish Government’s budget was around 25% higher than the equivalent in England, with the ratio not converging over time.
Five years later, we have updated these statistics to understand what the position in devolved spend is today and continue to track the trends. It should be noted that due to the COVID-19 pandemic, figures in the last year may distort previously consistent trends.
The key points are:
- Scottish devolved expenditure remains somewhere between a quarter and a third per head higher than comparable expenditure in England.
- The priority given to different spending programmes, relative to England, can be compared by looking at the extent to which expenditure on the individual programme is greater or lesser, and shrinking or growing, compared with England.
- This demonstrates the actual priorities put into practice by government, rather than their rhetoric.
- In particular, it demonstrates that over a prolonged period, the priority given to the National Health Service in Scotland is lower than given to it in England. Health expenditure in Scotland was once around 20% higher than in England – it is now more or less the same. At the same time, overall Scottish expenditure has not converged with the English level.
- Some of this represents expenditure on other priorities:
- Notably providing certain services free, such as higher education to university students without fees, but abolishing the previous graduate endowment which helped to pay for that
- Some prioritisation of adult social care, again to provide some of it free (the relative priority of health and social care together has however also declined relative to England)
- Expenditure on additional police officers, although these numbers have more recently been declining.
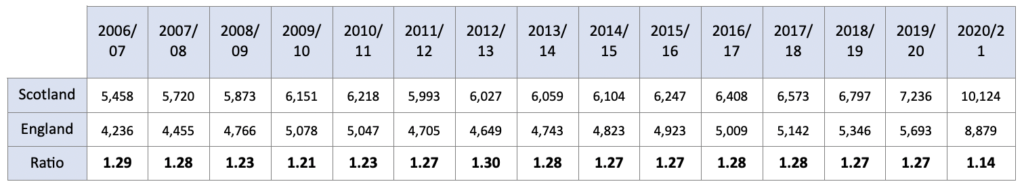
Table and Figure 1: Total Identifiable Spending in Scotland and England, per head (£).
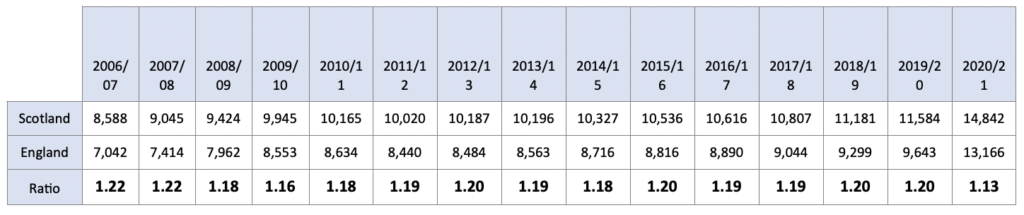
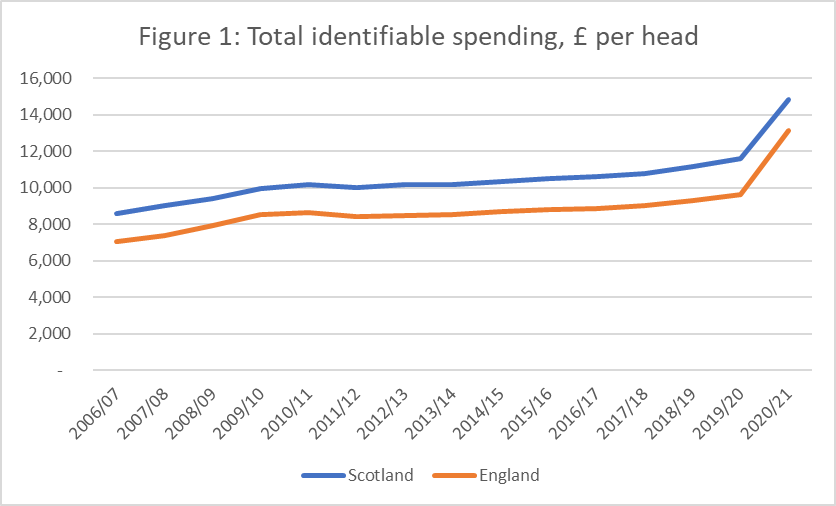
Over the past fifteen years, the total level of public spending in Scotland, per head, has been consistently higher than England. The difference in total identifiable spending per head, which includes expenditure by the UK and Scottish governments (although not expenditure such as defence or debt interest which is regarded as non-identifiable), has remained relatively consistent at around 20%, with no signs of convergence. The last reported year, 2020/21, was significantly impacted by the COVID-19 pandemic, but the trends remain.
The single largest public expenditure is on social protection, comprising mainly of transfer payments i.e. social benefits and pensions. Whilst Scotland has seen some uplift recently in certain social protection payments compared with the rest of the UK, across the board payments are relatively similar. Spending on public services other than social protection in Scotland is much higher than in England. Here, spending per head has averaged 26% above England.
Table and Figure 2: Identifiable spending other than social protection in Scotland and England, per head (£).
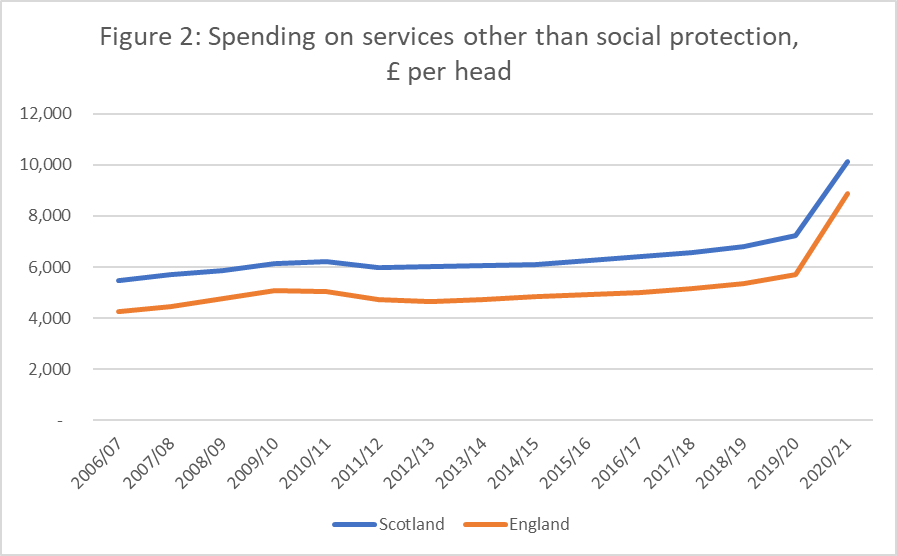
This shows that this extra spending in Scotland is predominantly concentrated in public services: around 80% of extra expenditure in Scotland compared with England. Graph 2 also clearly demonstrates that this extra public service spend has not changed over time; it consistently remains around 25% higher.
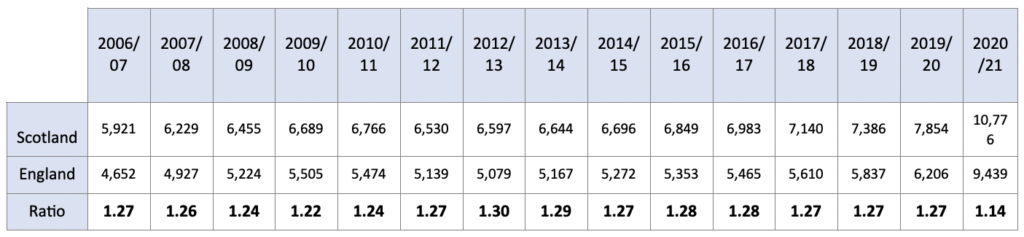
Since most public services in Scotland are devolved, i.e. the responsibility of the Scottish Government, it is important to understand this expenditure. Scottish data is readily available using Government Expenditure and Revenue Scotland (GERS), however, no such data is easily provided for England. Gallagher developed a proxy calculation using UK Treasury data to determine devolved spending in England and allow comparisons to be made.
This proxy calculation makes use of both the data in Table 2, as well as the personal social services expenditure from the social protection classification. Personal social services accounts for spending on adult social care and other mostly community-based social services. The proxy calculation developed by Gallagher consistently tracked GERS figures to within 3%. This calculation has continued to perform well (Figure 3), with spending figures in the past five years equating to around 96% of GERS figures. The most recent year has reduced due to extra expenditure to cover furlough and other pandemic related activity. This proxy may not be so useful in future, given the devolution of certain benefits expenditure.
Table and Figure 3: Proxy devolved spending for Scotland and England, per head (£).
These figures provide a good estimate to the ratio of devolved expenditure in Scotland compared with England. Over the past fifteen years, this spending has been consistently above 25% per head. With this in mind, it can be expected any variation in the ratio for individual services over the past fifteen years is principally due to decision making by devolved government differing from UK choices on spending allocations.
Using the UK Treasury data, it is therefore possible to track the spending priorities of the Scottish government over time, relative to the UK government on the same services in England. Some spending in Scotland leads England by a more significant margin than 25%. Water services in Scotland are publicly provided, and that expenditure is therefore obvious in the figures. Services such as running the Scottish Parliament, as would be expected, are also included. Higher spending is seen in housing, with decisions dating to before devolution – due to the greater proportion of social housing stock. Higher transportation per head spending may be partly due to geographical factors.
This analysis reviews in greater detail devolved spending on healthcare, education, and law and order.
Devolved Health Spending
Health spending accounts for the largest part of devolved spend – approximately 30% – and a larger proportion of the Scottish government DEL, the core budget over which they have spending choices. The data show a very noticeable lower priority for growth in health spending in Scotland, compared with England.
Table and Figure 4: Health spending in Scotland and England, per head (£).
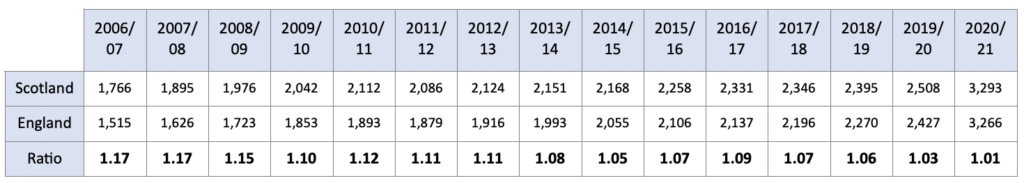
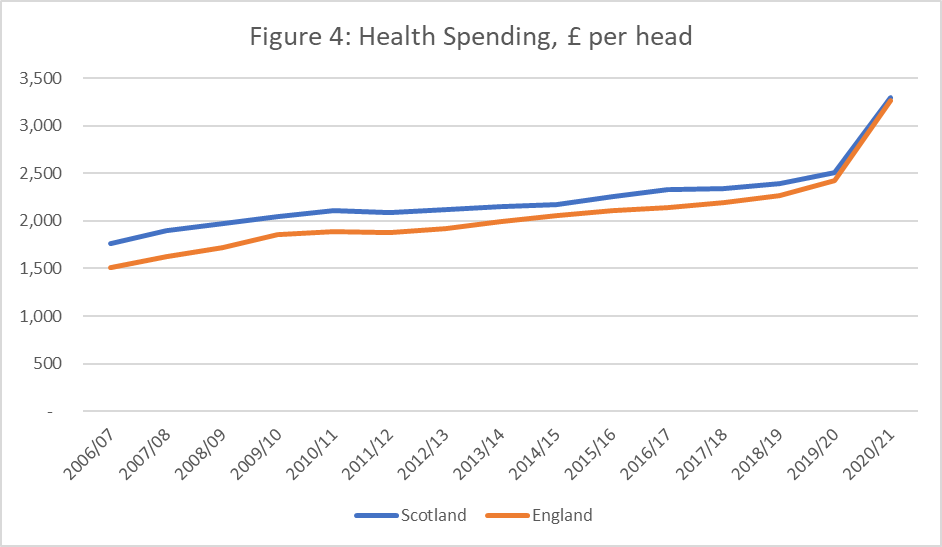
In 2006/07, per head health spending in Scotland was around 17% higher than England, £251 per person. Over the past fifteen years, this spending lead has reduced to near parity – just 1% in 2020/21, £27 per person. These values are not due to any spending squeezes to the Scottish budget, they are simply the difference in spending priorities between Scotland and England. It demonstrates the reduced priority given to growing health spending in Scotland, relative to England – per head spending has increased 86% in Scotland compared with over 115% in England.
Had Scotland maintained around a 20% spending advantage, health expenditure would have been an extra £2.2 billion; £405 per person per year. This would have risen to an extra £2.8 billion to the health system, £527 per person per year, had the spending advantage equalled the devolved ratio of 25%.
With the shift of healthcare toward the community, the reduction in health lead could be explained by increased funding in social care services. Table 5 does illustrate a spending advantage between Scotland and England, which has remained consistently above 20% these past fifteen years (except for the pandemic last year).
Table 5: Personal Social Services spending in Scotland and England, per head (£).
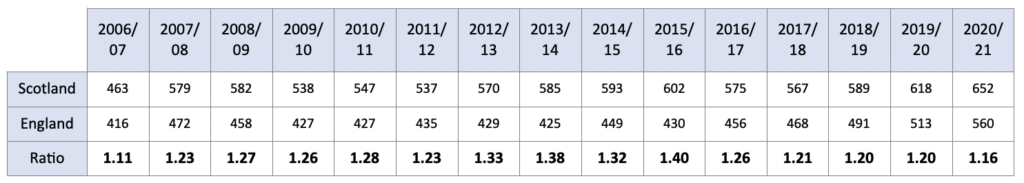
Whilst not all social care services will be applied to reduce the burden on the NHS, it makes sense to combine spending to understand the overall trend.
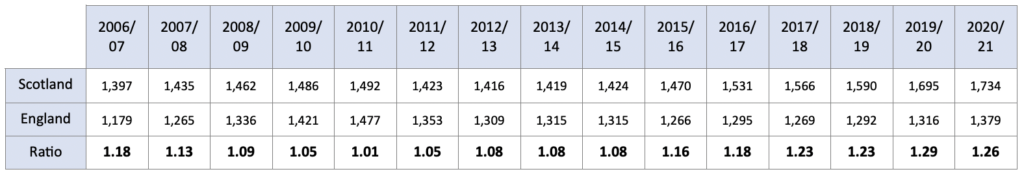
Table and Figure 6: Health and Personal Social Services spending, per head (£).
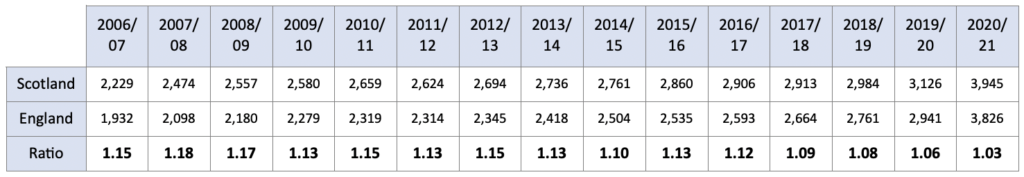
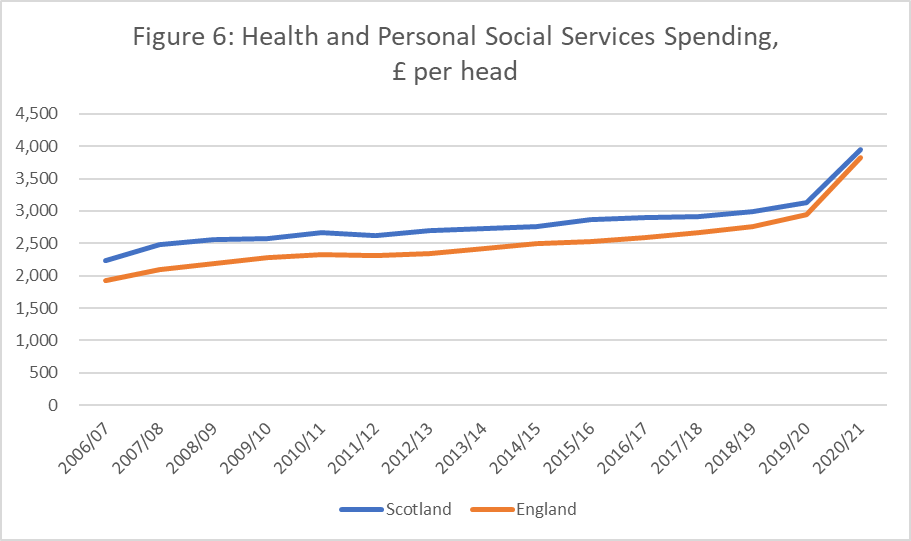
This trend equally shows a steady decline in the relative priority of health and social care services. In 2006/07, the spending lead for Scotland over England was 15%, £297 per person, reducing to 3% in 2020/21, £119 per person.
Devolved Education Spending
Education is the second largest devolved spend – around 15% – and a key policy priority for the Scottish government. The spending lead has varied substantially over the past fifteen years, predominantly due to changes in classification, however a consistent spending advantage of above 23% has been seen since 2017.
Table and Figure 7: Education spending in Scotland and England, per head (£).
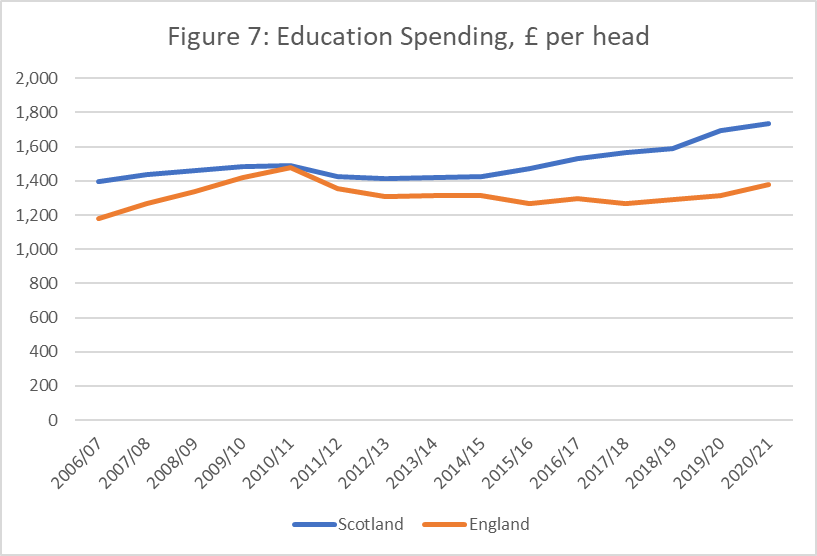
Within this overarching trend, we have some policy divergence, leading towards the increased spending advantage. The trend masks the somewhat surprising statistic that expenditure on schooling, has seen relatively little advantage, at least when compared with the 25% devolved spend. The ratio has fluctuated over the years, but notable that in the early 2010s, England spent more per head on schooling.
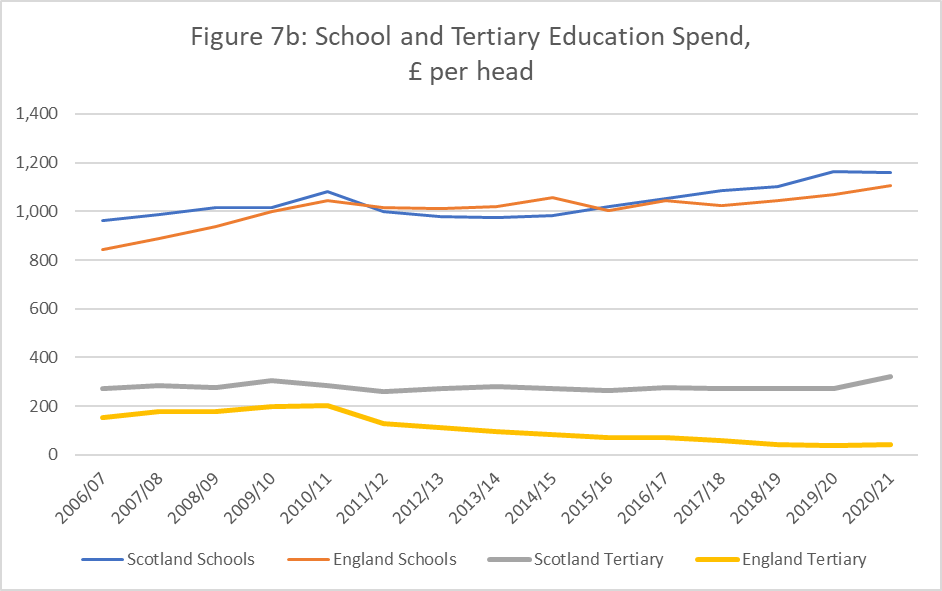
The most significant difference however is in tertiary education. With Scottish and EU students receiving free university education in Scotland, but no equivalent in England, this spending difference will continue to diverge. The abolition of the graduate endowment scheme, which was intended to provide offsetting revenue for the abolition of upfront fees, has left a gap on the revenue side of the equation and so increased spending.
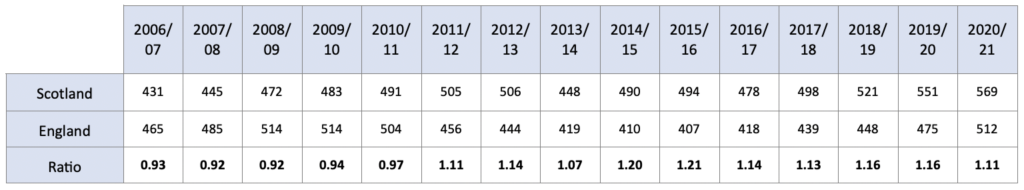
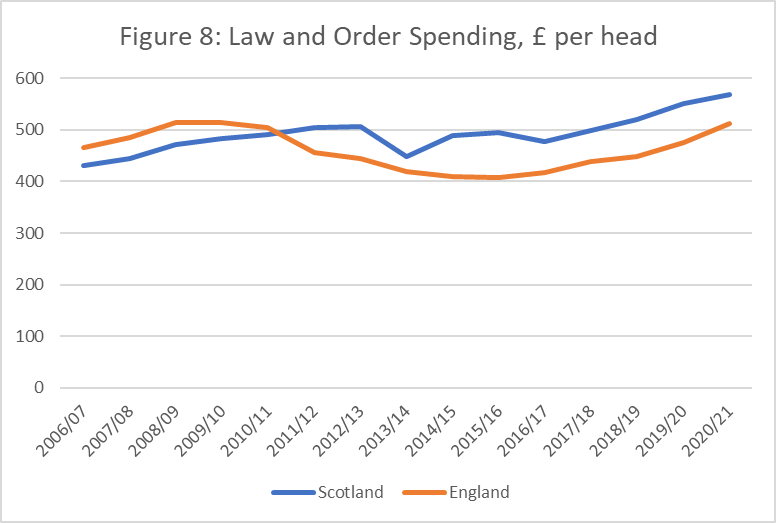
Devolved Law and Order Spending
On law and order, over the past decade, the spending advantage in Scotland has averaged around 15%, compared with England. Until last year, this advantage saw several years of growth. This is related to the political commitment to increase police officer numbers above the levels seen in 2007 (policing is the largest part of the law and order budget).
Table and Figure 8: Law and Order spending in Scotland and England, per head (£).